
Europe’s best and worst cities for commercial fleets revealed in free Webfleet Trip Monitor
Webfleet has launched a free online benchmark tool that tracks how easy or challenging it is for vans and trucks to operate across 32 major European cities.

The new platform reveals that operating conditions are becoming more challenging in many cities across Europe
Dubbed Trip Monitor, the new platform reveals that operating conditions are becoming more challenging in many cities across Europe.
The monitor uses anonymised and aggregated commercial vehicle data that’s updated monthly and shows how fleet operating conditions change over time.
For fleets, even small shifts in reach or idling can quickly translate into lost productivity, higher fuel consumption and additional emissions. By focusing exclusively on repeat commercial journeys rather than general traffic, the monitor gives businesses and city stakeholders a clearer view of where urban operations are becoming easier or harder.
Users can rank cities, compare performance and track changes over time using two key metrics, developed in partnership with mobility intelligence specialist Mobito.
The ‘15-Minute Reach’ ranking measures how far a typical van or truck can travel in a fixed 15-minute period. A higher score means vehicles cover more ground in the same amount of time.
Alongside this, the ‘Idling Intensity’ metric measures how much of a typical journey is spent stationary with the engine running. A higher percentage means more journey time is spent idling.
The first 2026 findings show clear differences between cities and countries.
The easiest cities for fleets include Zaragoza (Spain), Apeldoorn (The Netherlands) and Utrecht (The Netherlands), which all recorded the highest 15-Minute Reach scores, based on average monthly rankings since the start of 2026.
In contrast, Berlin (Germany), Paris (France) and Kraków (Poland) emerged as the most challenging cities for fleets after recording he lowest average 15-minute reach rankings in 2026.
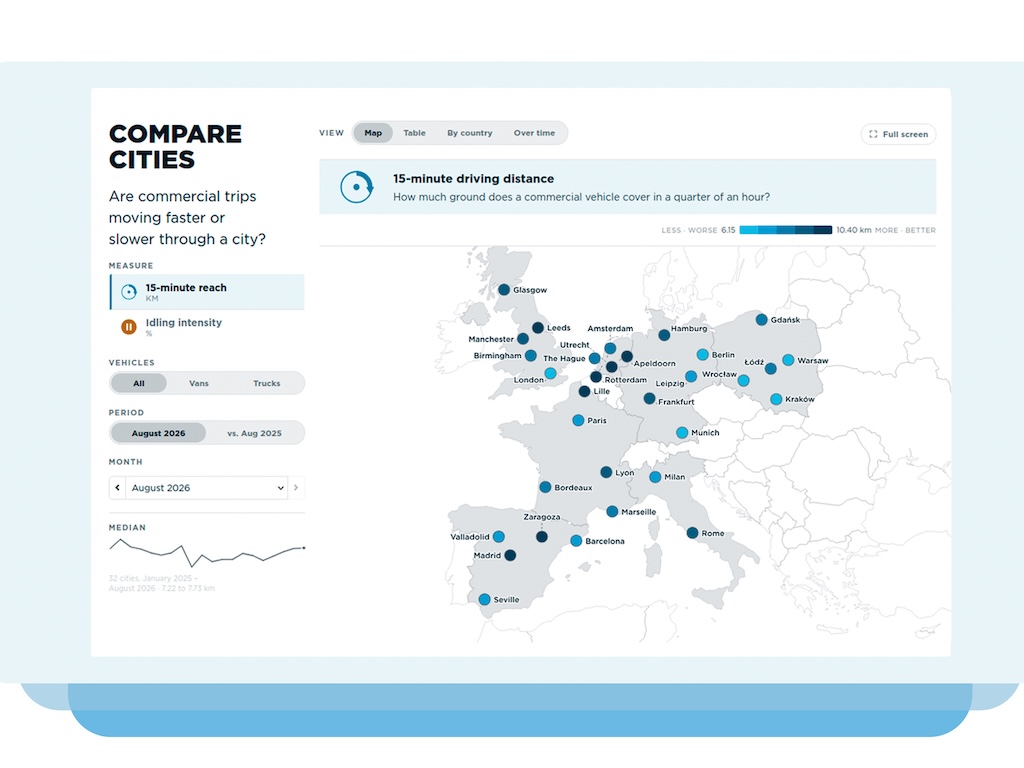
Users can rank cities, compare performance and track changes over time using two key metrics based on 15-minute reach and idling intensity
Poland topped the rankings for improvements across the board. It was the only country where every city analysed improved year-on-year for 15-Minute Reach, while maintaining stable or lower idling levels across almost every comparable month.
The study also reveals mixed results in Italy and declines in Germany. Rome and Milan improved year-on-year for 15-Minute Reach, but Milan had Europe’s highest Idling Intensity: 21% of a typical journey was spent stationary with the engine on, compared with 16% in Paris, France.
Berlin, Germany, ranked last overall for average 15-Minute Reach, while fleets in Munich, Leipzig and Hamburg covered 4.4%, 4.3% and 3.3% less ground respectively in 15 minutes than during the same period in 2025.
The Webfleet Commercial Trip Monitor draws on one of Europe’s largest connected vehicle ecosystems and Webfleet’s 25-plus years of experience supporting European fleet businesses to turn data into better decisions.
Jan-Maarten de Vries, president fleet management solutions at Bridgestone, said the monitor provides a clearer picture of urban mobility through the lens of fleet operations.
“Commercial vehicles do not experience cities the way commuters and consumers do. They follow different routes, operate under different regulations, make multiple stops, and load and unload.
“When conditions change due to congestion, roadworks, low-emission zones, regulation or major events, fleet businesses often feel the impact first. Even relatively small changes can affect productivity, operating costs, fuel use and emissions.”
In addition to the two core metrics, users can explore individual cities in more detail, including trip volumes, distance driven, CO₂ emissions, fuel consumption and the local factors shaping operating conditions.
To ensure comparisons are meaningful, journeys are grouped into comparable route families and assessed using a fixed-panel methodology designed to track changes consistently over time.
Full findings from the Webfleet Commercial Trip Monitor are online here.
Webfleet Commercial Trip Monitor
Natalie Middleton

Natalie has worked as a fleet journalist for nearly 20 years, previously as assistant editor on the former Company Car magazine before joining Fleet World in 2006. Prior to this, she worked on a range of B2B titles, including Insurance Age and Insurance Day. Natalie edits all the Fleet World websites and newsletters, and loves to hear about any latest industry news - or gossip.